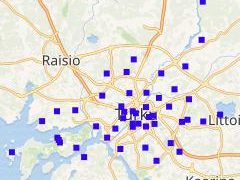
We are glad to announce that part of the TURCLIM data is now available in Excel format. The data consist of the TURCLIM observation points, and their x- and y-coordinates. TURCLIM data include the average temperatures of the observation points that have been measured in August 2006 and 2007. For example land use and elevation data have been extracted around the observation points, and produced new spatial data through the reclassification and the neighborhood analysis.
As a result of previous process the following environmental variable groups were created:
- Proportions of various land use types of the total area of the zone surrounded by observation point
- Elevation of the observation points in relation to the average height of the environment
- The area of water bodies from the total area of the zone surrounded by observation point
Around the observation points are zones, which are optimally sized in relation to different environmental variables. The environmental variable groups are in a numerical form and they are used to explain the average temperatures from August 2006 and 2007 in the same file. The table data can be easily converted to shapefile format, where the observation points construct a point spatial data set. More detailed information about environmental variables, such as the land use categories can be found in the cell comment field.
Table 1. An example how to utilize the data provided
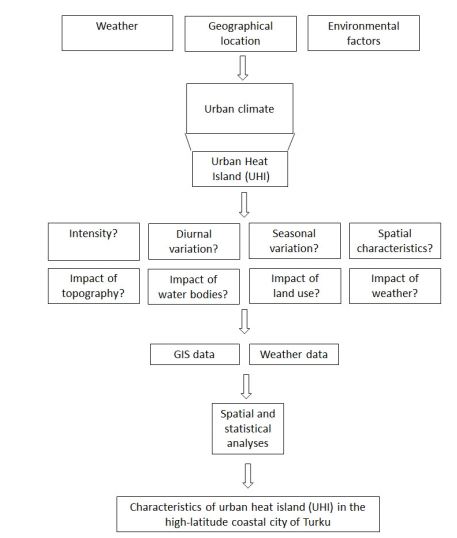
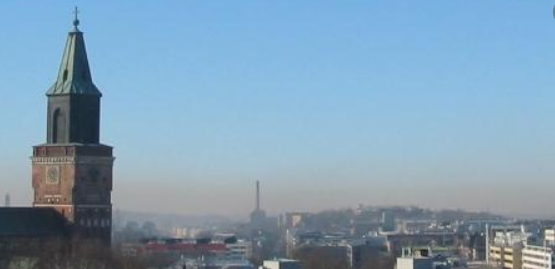
Suomi & Käyhkö 2020 The impact of environmental factors on urban temperature variability in the coastal city of Turku, SW Finland (https://doi.org/10.1002/joc.2277) is highly recommended to read, if you need specific information about the data process. Aim of the article is to improve understanding related to climatological variations in and around the city of Turku by providing and analysing data. Better understanding of urban heat island (table 1) can help to take it into account when it comes to urban planning. Human activities produce heat and add up to the urban heat island phenomenon which means that there tend to be higher temperatures in urban areas compared to the surrounding rural areas. The physical structure of the urban climate differs greatly from other types of landscape which makes urban areas a special case for climatology research. The city of Turku is an unique environment to study local climate, due to the highly variable topography and strong impact of the sea.
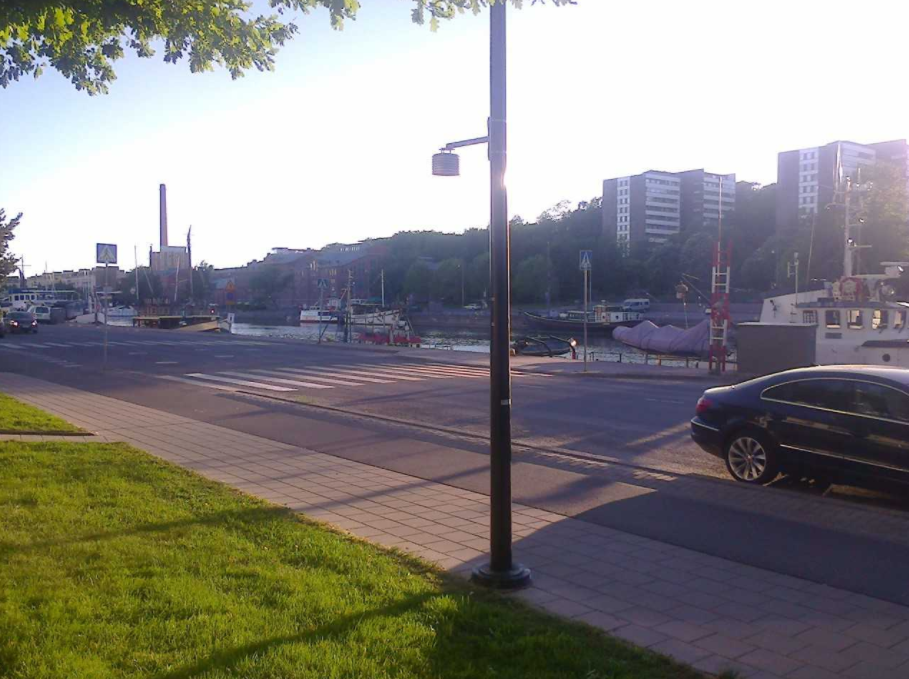
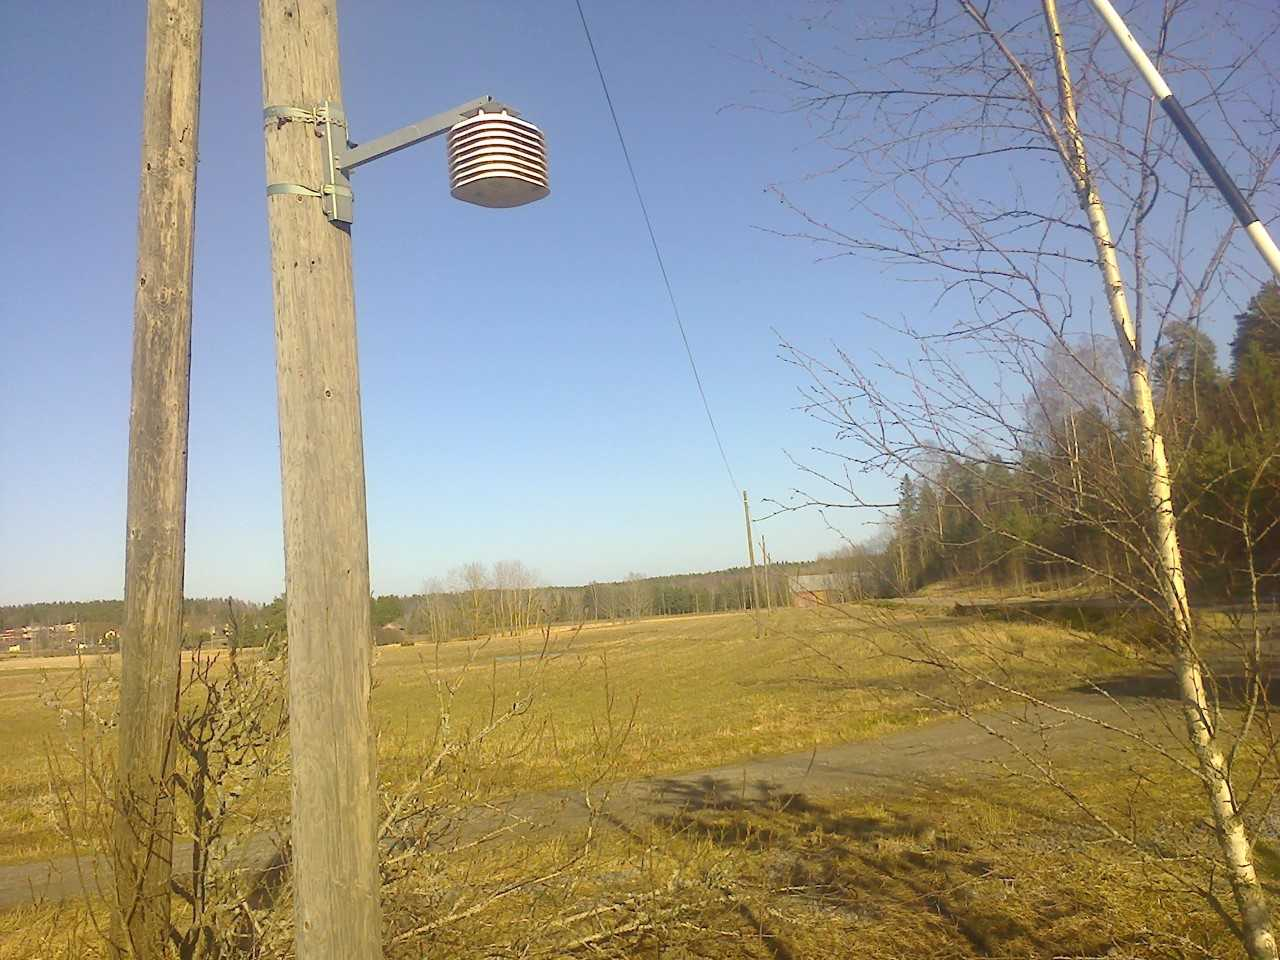
Photo 1. The weather loggers in Ylijoki and Martti measuring the air temperature
The data collection network consists of around 75 weather loggers and 3 advanced weather stations. The weather loggers (photo 1) measure the air temperature and since 2010 also humidity, the observation interval is 30 minutes. The advanced weather stations measure as well soil temperature, precipitation, solar radiation, net radiation, air pressure and wind direction and speed.
More information about the Turku Urban Research Project (TURCLIM) can be found: https://sites.utu.fi/turclim/. The research group welcomes everyone interested to take part in its activities and utilize the data collected in their own work.
What is TURCLIM?
- Turku Urban Climate Research Project (TURCLIM) was initiated in 1998 by the Department of Geography to study spatial patterns of urban climate
- The project is now permanent part of the research and teaching activities of the department, and become a member of the European collaboration network focusing on urban climate monitoring and research