The data gathering of development preferences for the Aninkainen Concert Hall is a good example of coinciding interests among researchers, software developers and the city authorities in Turku, Finland. The data was collected through a map-based survey, which utilizes a 3D city model of Turku as the mapping background. The 3D offered the respondents a totally new perspective to view the planning area in contrast to a conventional 2D map.
In the spring of 2021, Associate Professor Nora Fagerholm from the University of Turku was contacted by two Finnish software companies, Mapita and Sova3D, to pilot the use of 3D visualization in the map-based survey tool, Maptionnaire. Maptionnaire is a commonly used online survey tool that is in use in many cities globally. Combining Maptionnaire platform with the 3D city model enabled designing a novel kind of survey experience. The city of Turku offered a case study site for the pilot and was keen to see how the city model can be utilized in participatory mapping with residents.
The city block of Aninkainen Concert Hall is culturally and historically significant part of Turku, yet a bit unknown to many people due to its closed public spaces. The block includes the concert hall and a large vocational school compound with 1950’s functional style architectural value. The aim of the survey was to increase knowledge of this specific part of the city and collect ideas for its future development. The online survey was linked to an on-going planning process of the city block and as such the survey data would potentially be used in developing the area.
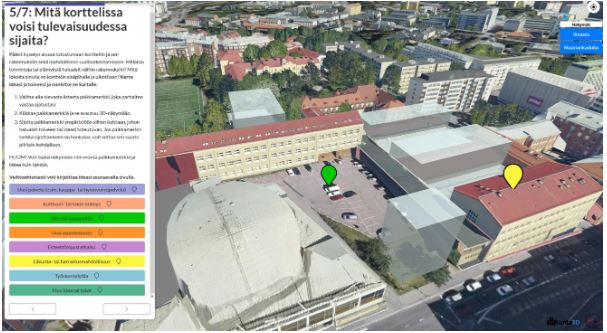
The online 3D survey was advertised to residents in and around Turku through social media and press release. In a few weeks’ time, 19.3.-11.4.2021, the survey gained altogether 368 different ideas, i.e. map markers, from 135 respondents. In the survey, respondents were able to view the city block as a fly through around the block and free navigation in the 3D view (Figure 1). They were also able to open information boxes with descriptions and photos of the buildings and their interior.
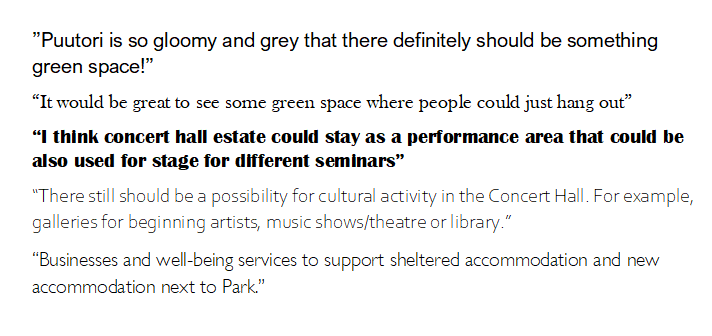
The data shows that green and open public space for relaxed recreation was the most desired development trend (Figure 2). Also, people hoped different cultural events and meetings to be staged in the city block. Third most common wish addressed specialised shops and well-being and health services. Development of housing and accommodation were less wanted.
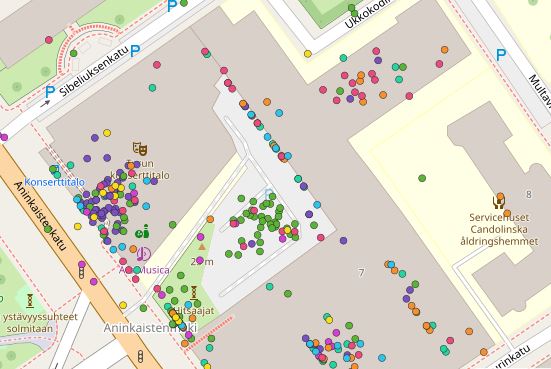
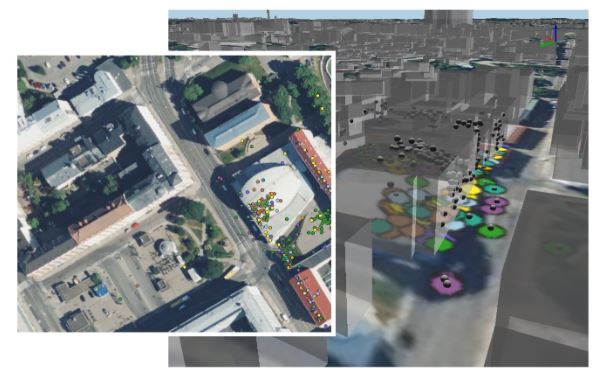
Before visualisation, data was curated by geography students from the Department of Geography and Geology of the University of Turku as a practical exercise in the course Data management and Visualization. The data was visualized as one point layer that includes all respondents’ map markings and descriptions of different wishes as attribute data. As all points had x-, y- and z-coordinates, it was possible to visualise and analyse the data both in 2D and 3D (Figure 3).
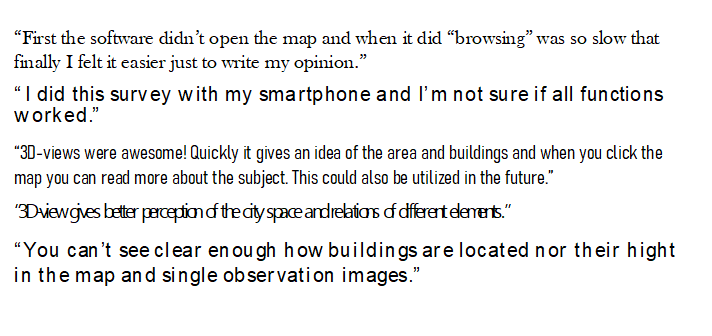
The collaboration with the software developers and city planners enabled the development of the new 3D map-based survey experience. Furthermore, piloting it in a real-life planning process thanks to the interest of the city of Turku provided the opportunity to show its potential for participatory planning. According to the respondent feedback, the 3D-view helps respondents to gain more comprehensive understanding of the planning area (Figure 4). Especially the photograps and free navigation in the 3D view increased their understanding of the area and, thus, potentially helped in suggesting future wishes.
Over half of the respondents considered the online 3D survey easy to use and would recommend it use in the future. However, making the map markings, free navigation and slow loading time of the 3D view, especially on smartphones, were considered difficult by some users. Thus, the online 3D survey offers benefits for citizen engagement and can be considered as one tool among many for participatory planning processes. The technical challenges still require further development.