Would it be nice to know the hottest or coolest place in Turku? Would you like to choose the best sand beach or to escape the most awkward heat wave to a park? Seriously, heat stress strikes in a worst manner to diseased and elderly people, and it is reality also in Finland. In an era of climate change urban climatological research gives valuable information about temperature differences. Geographical and temporal related urban climatology has numerous applications for example city planning, health issues and geographical segregation.
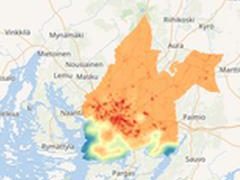
This dataset is a raster file which represents a heat sum in 2002 from May to August in the city region of Turku, Finland. In addition of Turku city, the data covers municipalities of Kaarina, Lieto, Raisio and Rusko.
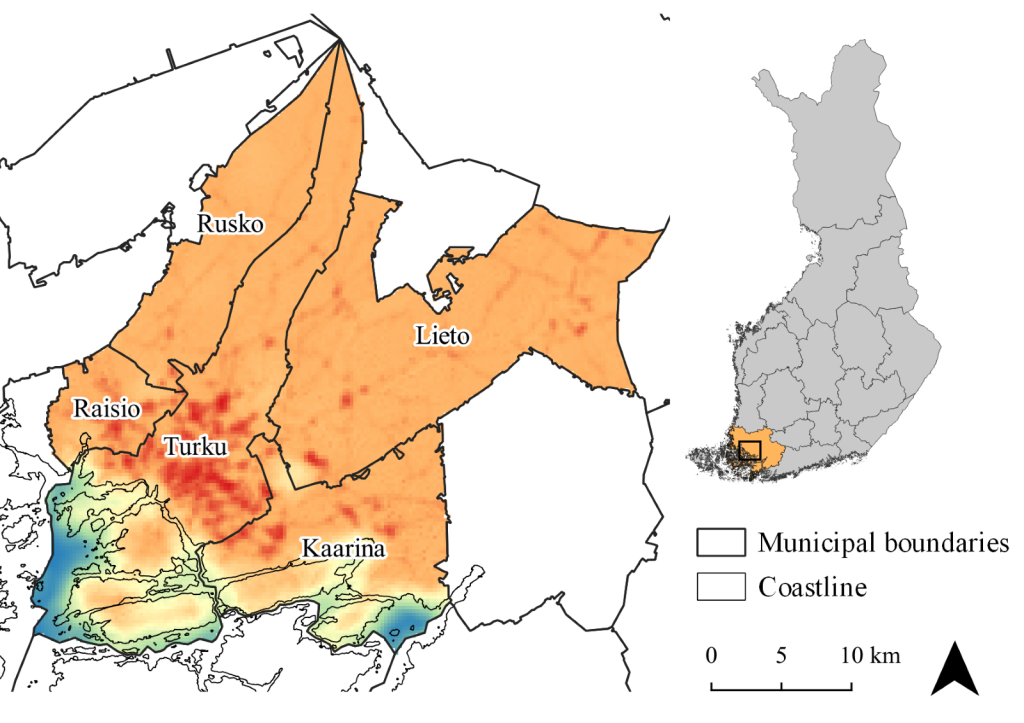
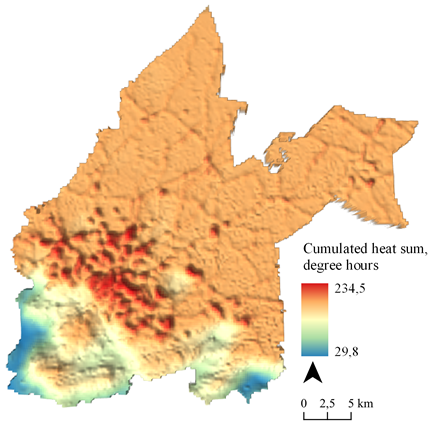
The data represents how many degree-hours it has cumulated during May, June, July, and August of 2002 in a particular 250 m grid square if the temperature has been over 25 Celsius degrees. For example, if the temperature has been 26 Celsius degrees for five hours, it means five degree-hour in the data. If the temperature has been 27 Celsius degrees for five hours, it means ten degree-hour in the data.
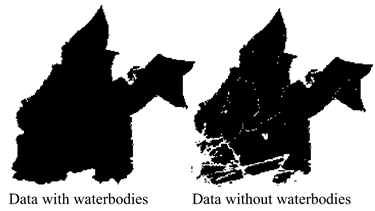
The cumulated temperature map has been produced using multiple linear regression model based on TURCLIM temperature observations, CORINE land cover data, SLICES land use data, and digital elevation model. You can download the dataset with and without body of waters. Below you can see the differences in coverage between those two datasets.
TURCLIM data is quite unique and exciting. TURCLIM (Turku Urban Climate Research Project) is a project by the Department of Geography from the University of Turku. It was initiated in 1998, and their main objective is to study urban climate using a network of permanent temperature- and humidity loggers. In 2002 there was already around 70 loggers in use, located in various environments both in the urban city centre and the surrounding areas. They are located 3 m above the ground inside radiation shelters to receive accurate and comparable data. The logger network was one of the densest used in urban climate studies in a coastal city, and now, in 2021 it has already been constantly in operation for 20 years. The data has been in a key role for researching small scale urban climate and has given insight to how which variables affect the local temperatures.
This dataset was created in December 2020 as a part of HERCULES project, which is a consortium of researchers from the University of Turku, the Finnish Meteorological Institute and the University of Helsinki. The aim of the project is to research the effects of climate change on individual persons. This dataset has not been released in HERCULES publications but is an interesting result of data analysing related to researched topics.
For you to get a bit closer look on the data, below you can compare cumulated heat sum map to the corine land cover data. Can you find similarities between them?
This dataset is open for all, and you can easily see the temperature differences within the coastal city of Turku!